> ## Documentation Index
> Fetch the complete documentation index at: https://docs.claimr.io/llms.txt
> Use this file to discover all available pages before exploring further.
# Usage Data
> See detailed breakdowns, projections, and historical records of your subscription performance, connected directly to the values shown in Billing.
Usage Data gives you an overview of your subscription performance. It connects directly with the values shown in Billing and expands them with detailed breakdowns. Projections highlight whether usage is on track or likely to exceed your plan, and historical records make it possible to compare consumption across different subscription periods.
Usage Data also shows the actions behind that performance. Depending on your subscription type (Credits or Monthly Active Users), it details how much of the allocation has been used and which tasks or users contributed to it. The data updates in near real time, so you can monitor the progress of your campaigns as activity occurs.
## Tables
There are several types of tables in Usage Data.
### Overview table
The first table aggregates actions performed during the subscription period. Each row includes:
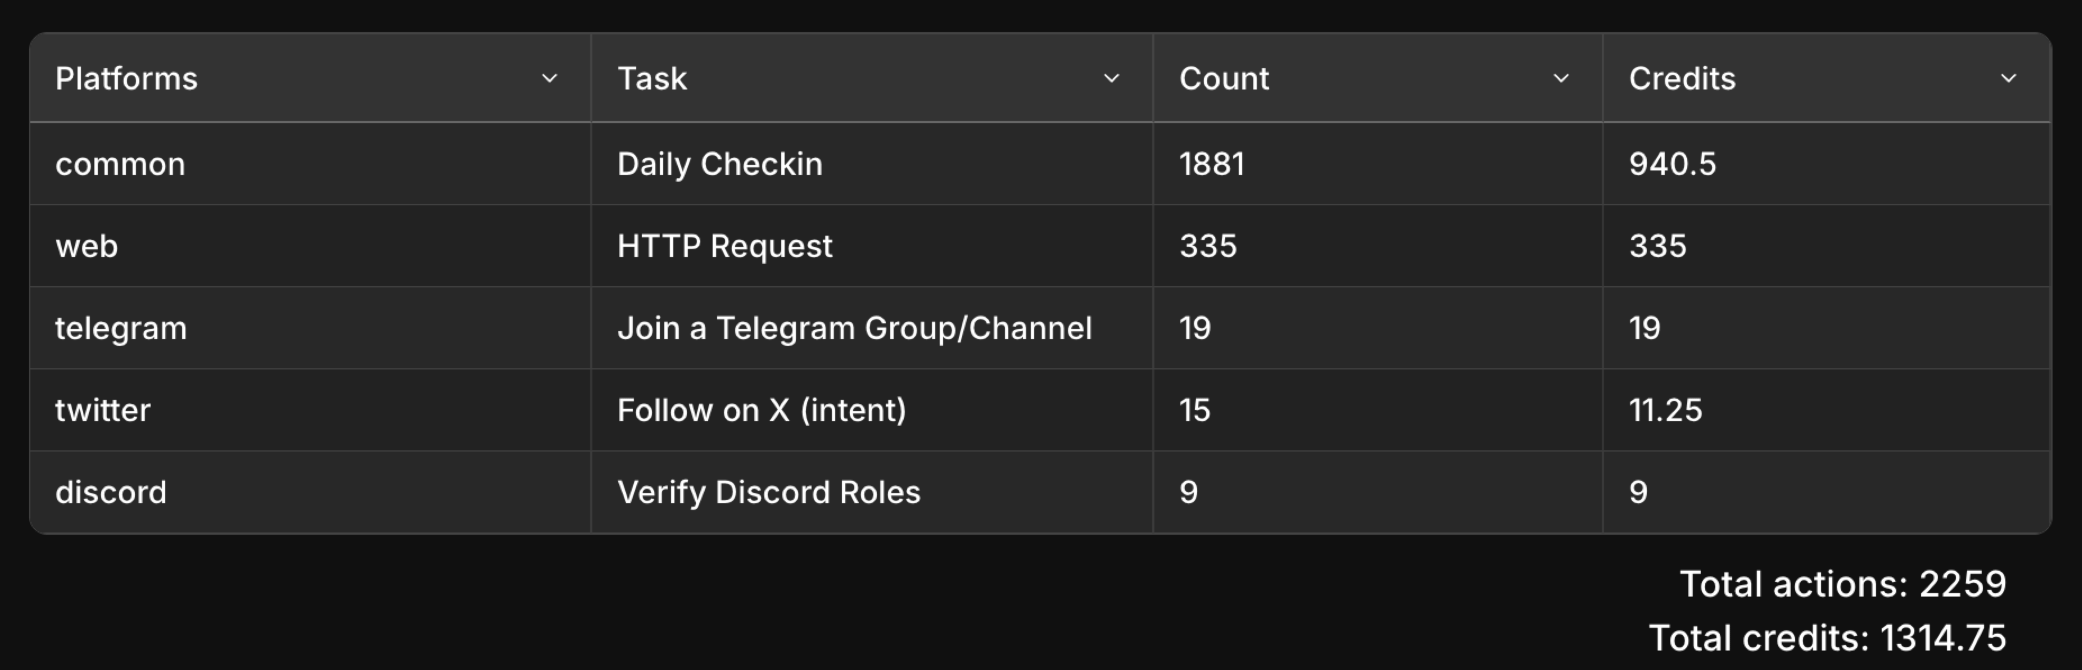 * Platform (e.g., Twitter, Web, Web3)
* Task name
* Execution count
* Credits spent (for credit-based subscriptions)
This gives you a grouped summary of activity, showing how often each task was completed and how many credits it consumed in total.
### Detailed task log
The second table provides a chronological log of every single task performed. Each row includes:
* Platform (e.g., Twitter, Web, Web3)
* Task name
* Execution count
* Credits spent (for credit-based subscriptions)
This gives you a grouped summary of activity, showing how often each task was completed and how many credits it consumed in total.
### Detailed task log
The second table provides a chronological log of every single task performed. Each row includes:
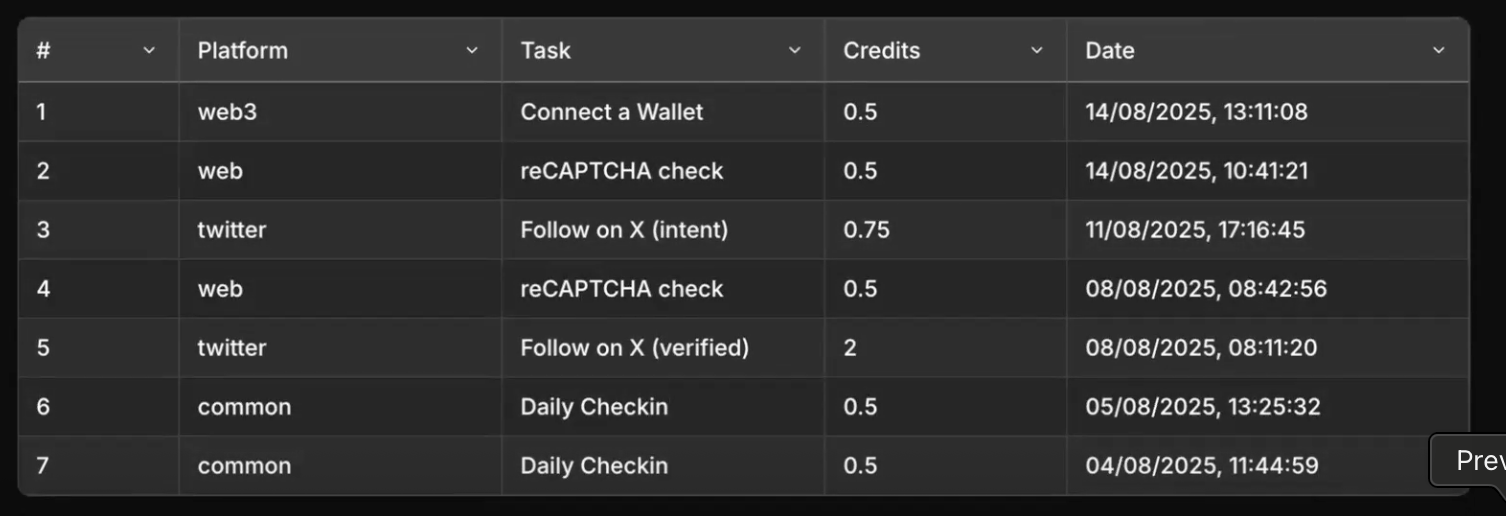 * **#** — the sequence number of the action
* **Platform** — where the task was executed
* **Task** — the specific task type (e.g., Connect a Wallet, reCAPTCHA check, Follow on X)
* **Credits** — the cost of that individual task in credits
* **Date** — the exact timestamp of when the task was executed
This log gives you a granular view of usage, making it possible to audit activity and track exactly when and how credits were spent.
## Graphs
### Credits usage graph
* **#** — the sequence number of the action
* **Platform** — where the task was executed
* **Task** — the specific task type (e.g., Connect a Wallet, reCAPTCHA check, Follow on X)
* **Credits** — the cost of that individual task in credits
* **Date** — the exact timestamp of when the task was executed
This log gives you a granular view of usage, making it possible to audit activity and track exactly when and how credits were spent.
## Graphs
### Credits usage graph
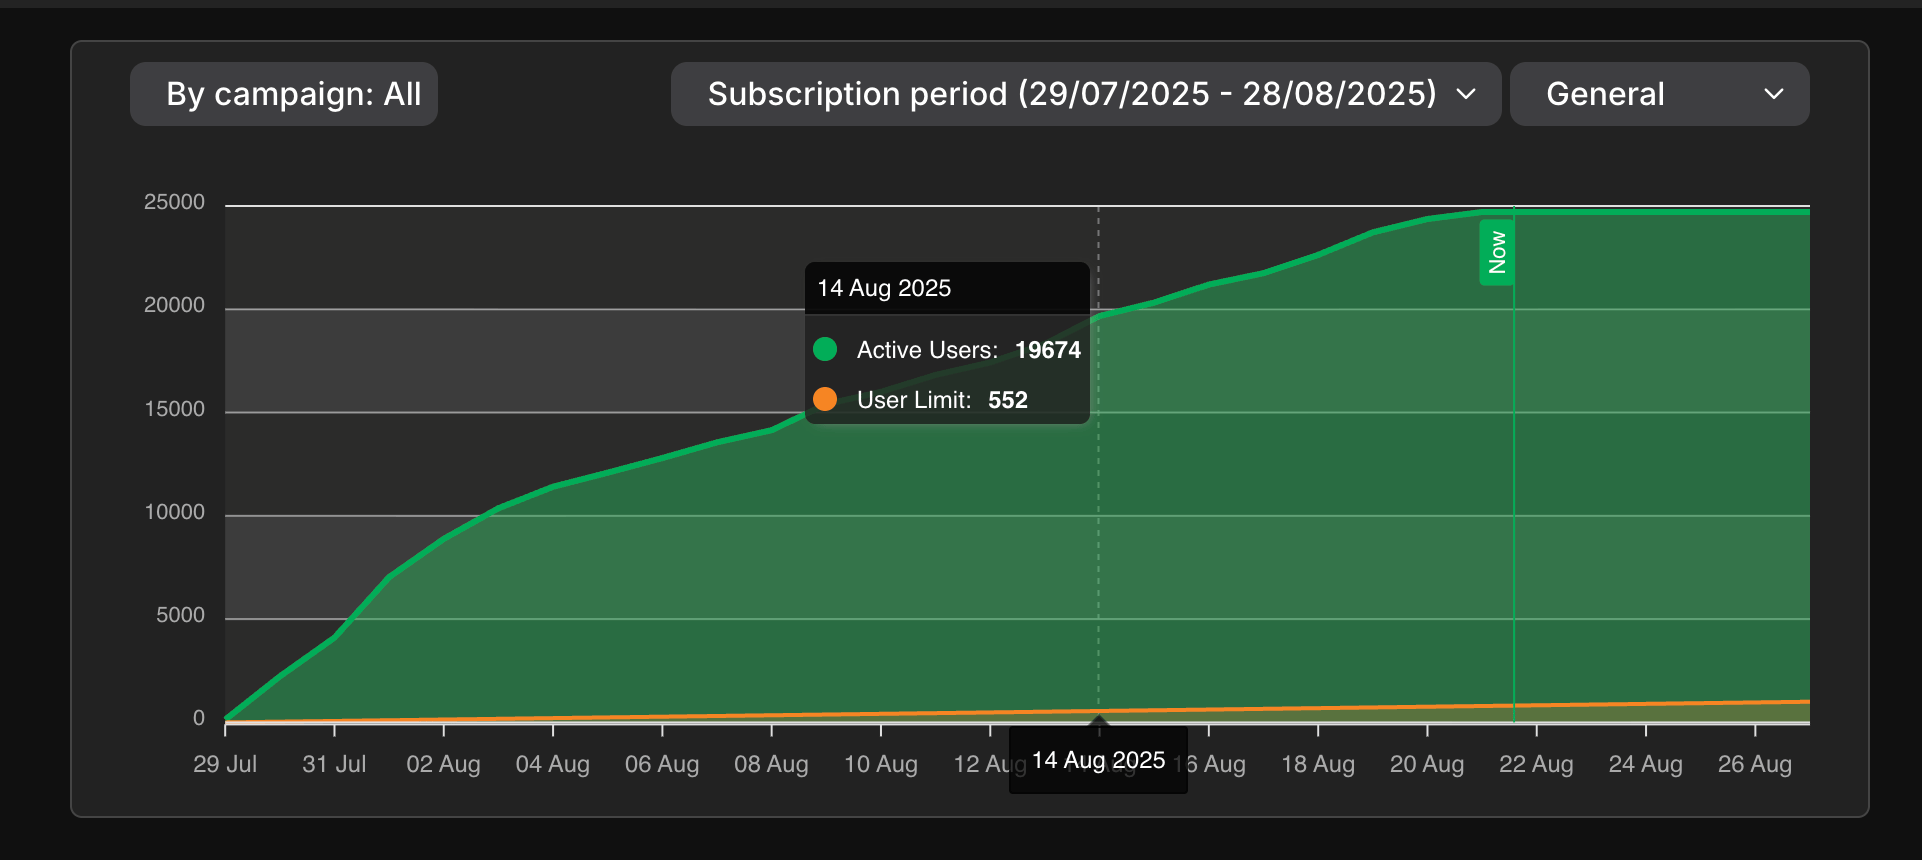 * Green area: credits used in real time.
* Orange line: projected usage until the subscription ends.
* Yellow line: subscription credit limit. This shows if you are likely to exceed your plan.
### Task type graph
* Green area: credits used in real time.
* Orange line: projected usage until the subscription ends.
* Yellow line: subscription credit limit. This shows if you are likely to exceed your plan.
### Task type graph
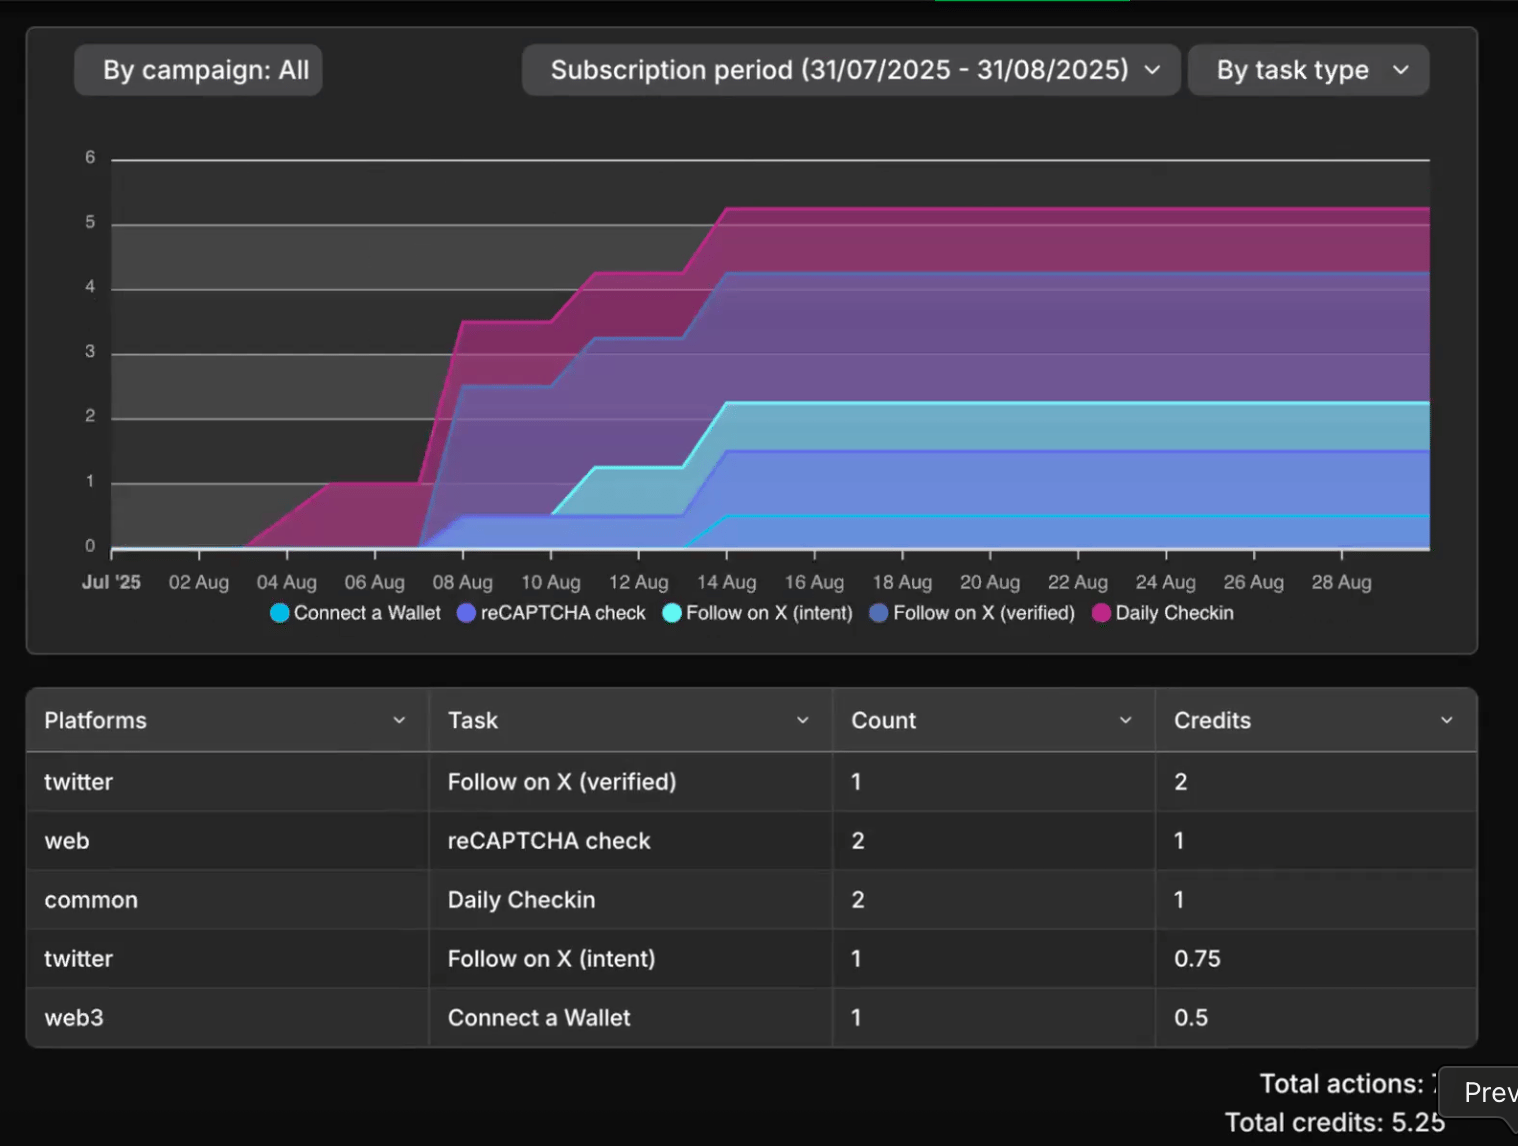 * Displays how many times each task type was executed.
* Tasks can be enabled or disabled for comparison.
### Filtering and time ranges
You can filter by campaign, subscription period, or custom date range. Resetting filters returns the view to the active subscription.
#### History
Past subscriptions are listed in a history table. This history allows you to compare previous subscriptions and track how your usage has changed over time.
* Displays how many times each task type was executed.
* Tasks can be enabled or disabled for comparison.
### Filtering and time ranges
You can filter by campaign, subscription period, or custom date range. Resetting filters returns the view to the active subscription.
#### History
Past subscriptions are listed in a history table. This history allows you to compare previous subscriptions and track how your usage has changed over time.