
Tables
There are several types of tables in Usage Data.Overview table
The first table aggregates actions performed during the subscription period. Each row includes: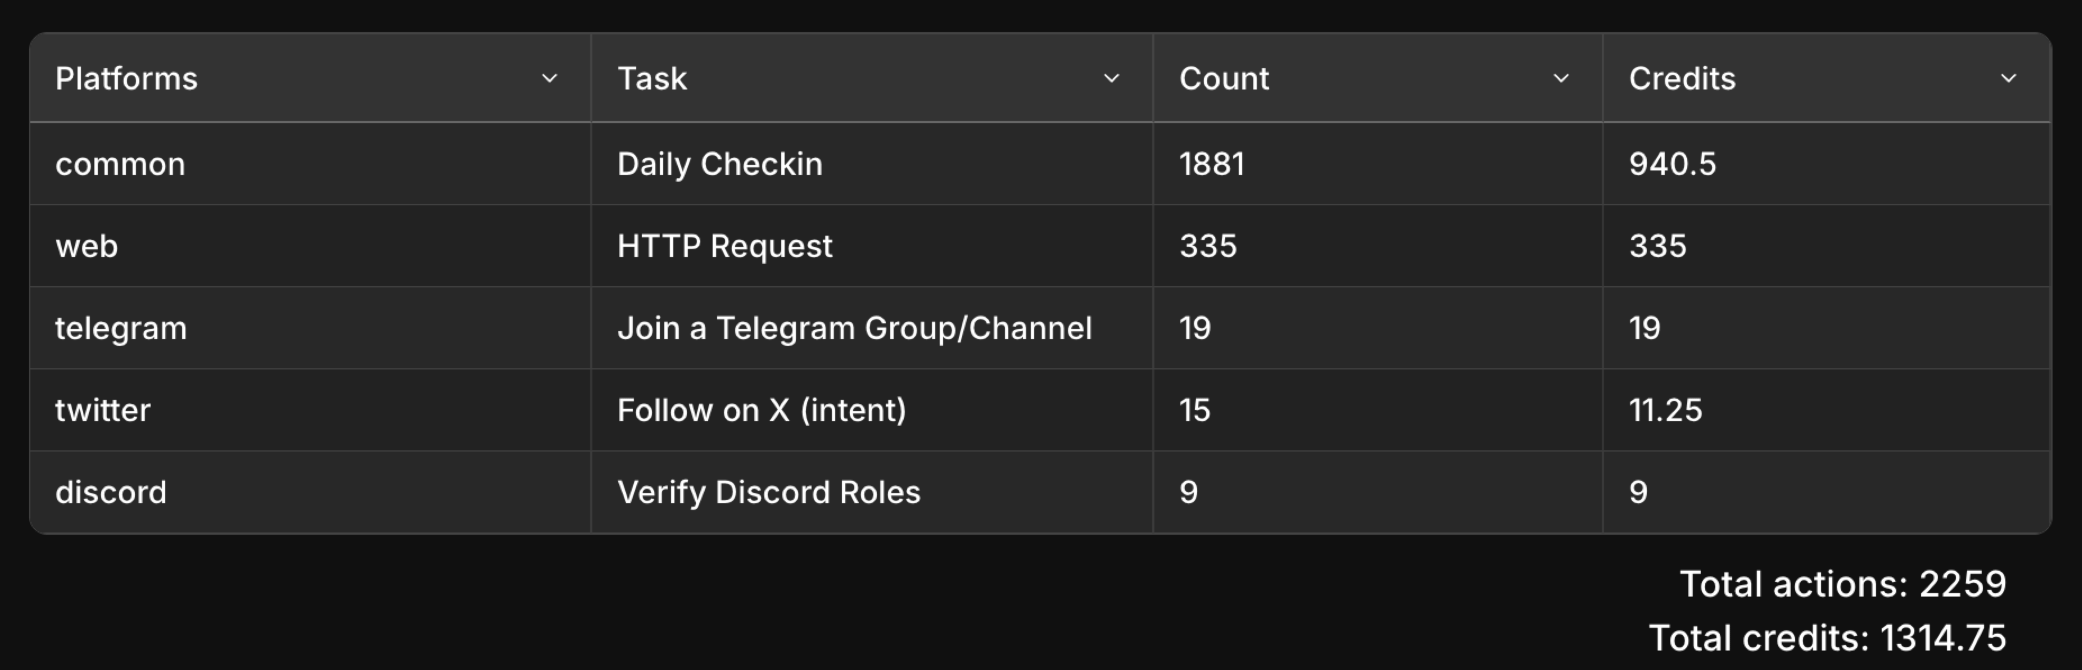
- Platform (e.g., Twitter, Web, Web3)
- Task name
- Execution count
- Credits spent (for credit-based subscriptions)
Detailed task log
The second table provides a chronological log of every single task performed. Each row includes: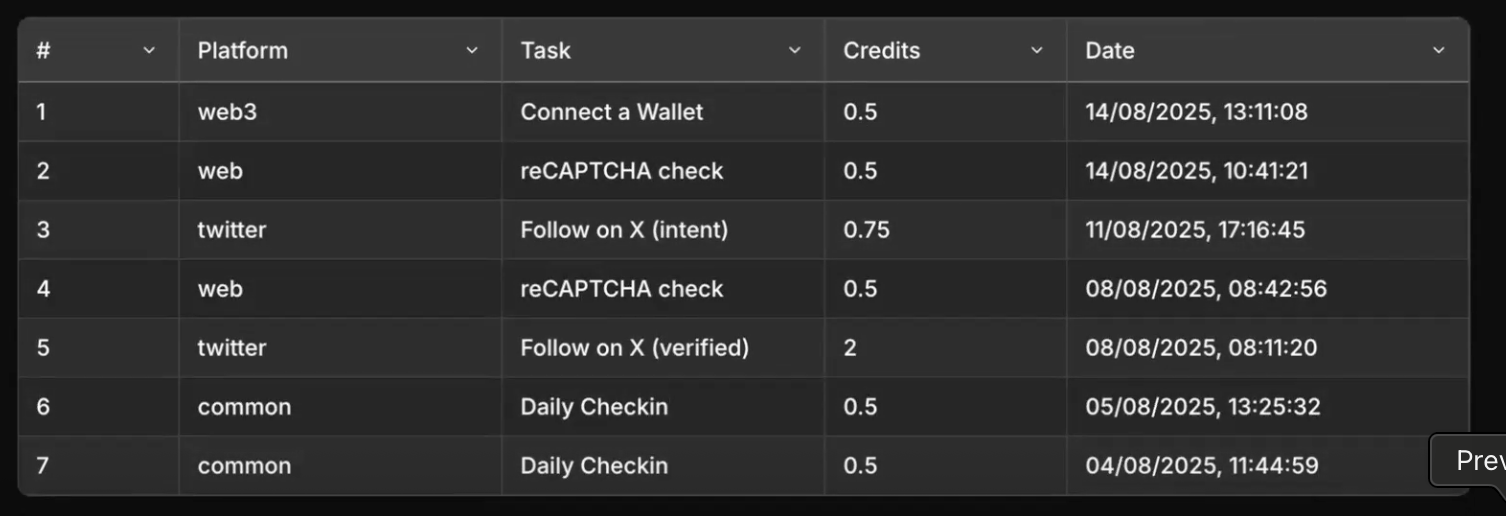
- # - the sequence number of the action
- Platform - where the task was executed
- Task - the specific task type (e.g., Connect a Wallet, reCAPTCHA check, Follow on X)
- Credits - the cost of that individual task in credits
- Date - the exact timestamp of when the task was executed
Graphs
Credits usage graph
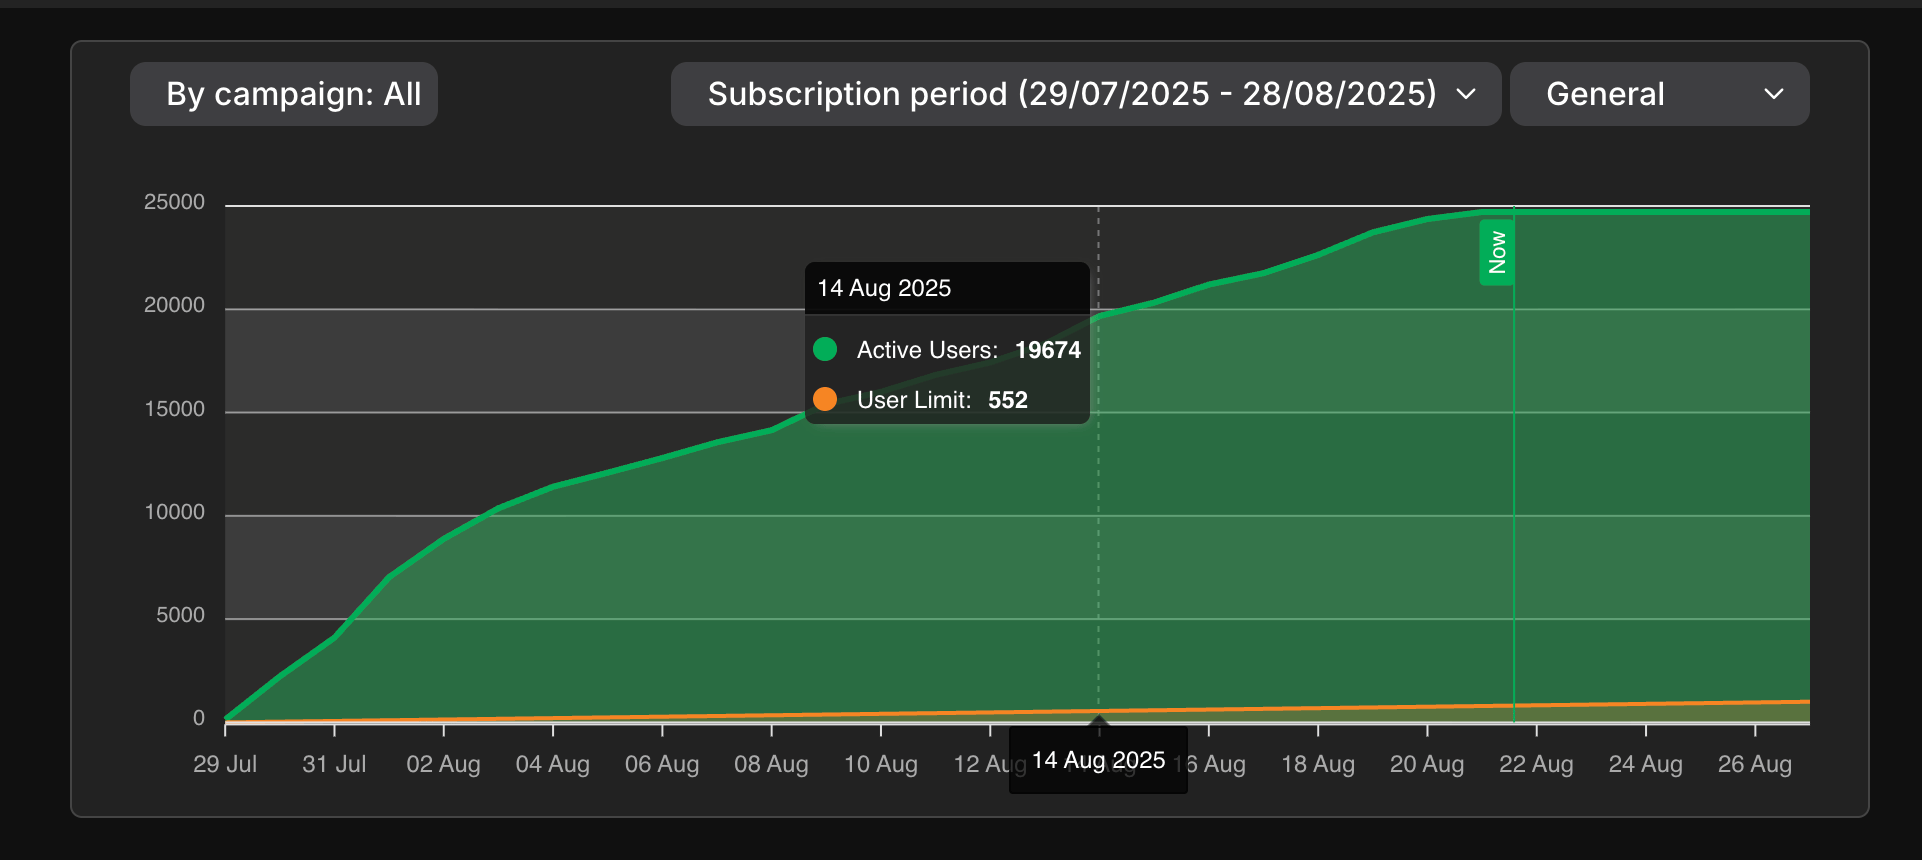
- Green area: credits used in real time.
- Orange line: projected usage until the subscription ends.
- Yellow line: subscription credit limit. This shows if you are likely to exceed your plan.
Task type graph
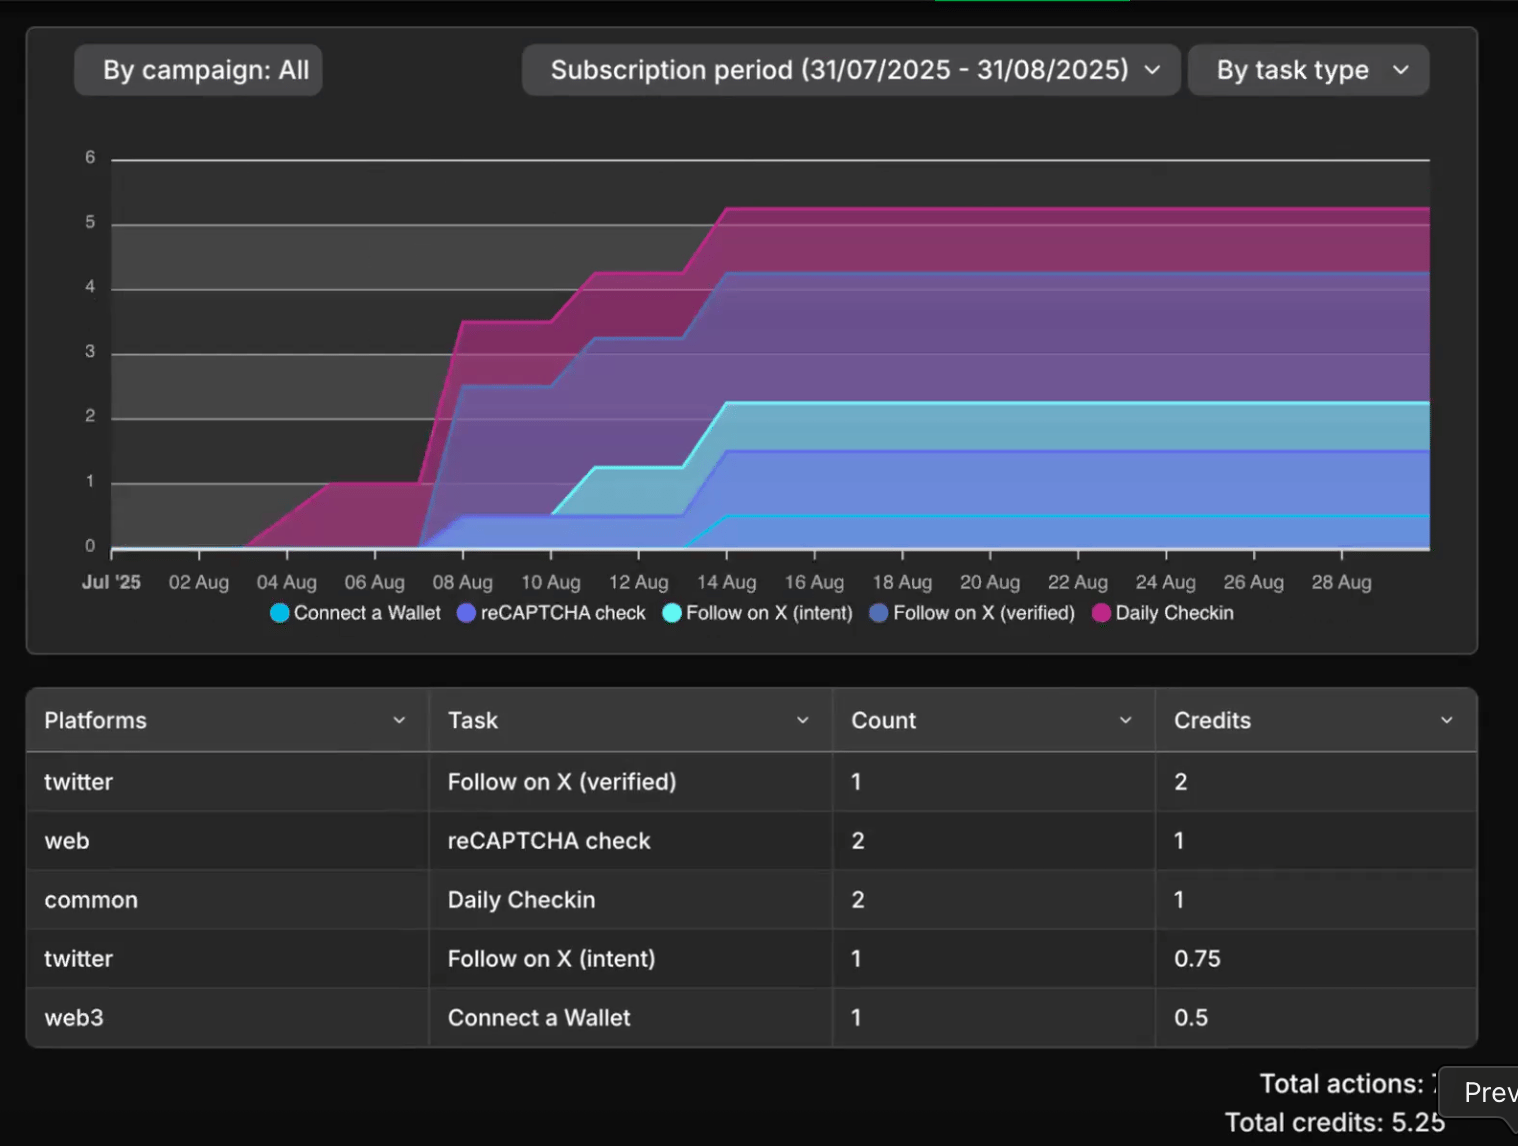
- Displays how many times each task type was executed.
- Tasks can be enabled or disabled for comparison.